


Annotations
Contents
Annotations enable you to add written notes to a particular day or time on all your insights and dashboards so you can see how changes or incidents impact your metrics.
You can use annotations to mark things like feature updates, version releases, and marketing campaigns, which adds helpful context when you're looking into what might have caused a change in your metrics.
Why Annotations are useful
The chart below shows a large spike in website traffic, which has been annotated to explain why that spike occurs. Annotations can be viewed by hovering over them.
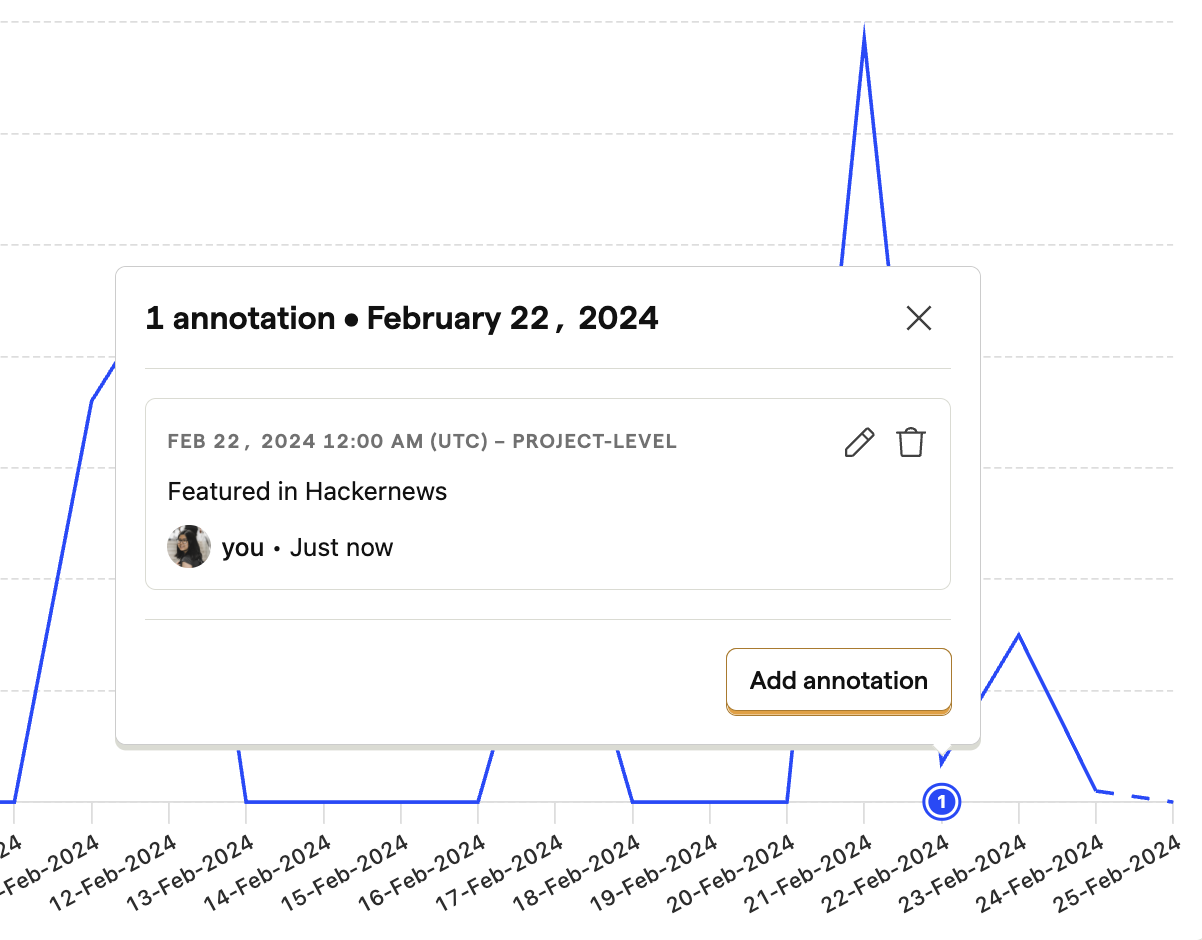
Annotations can be written after the fact, which makes them useful for future reference, or before an event if you want to analyze the future impact of a particular marketing initiative, for example.
Creating an Annotation
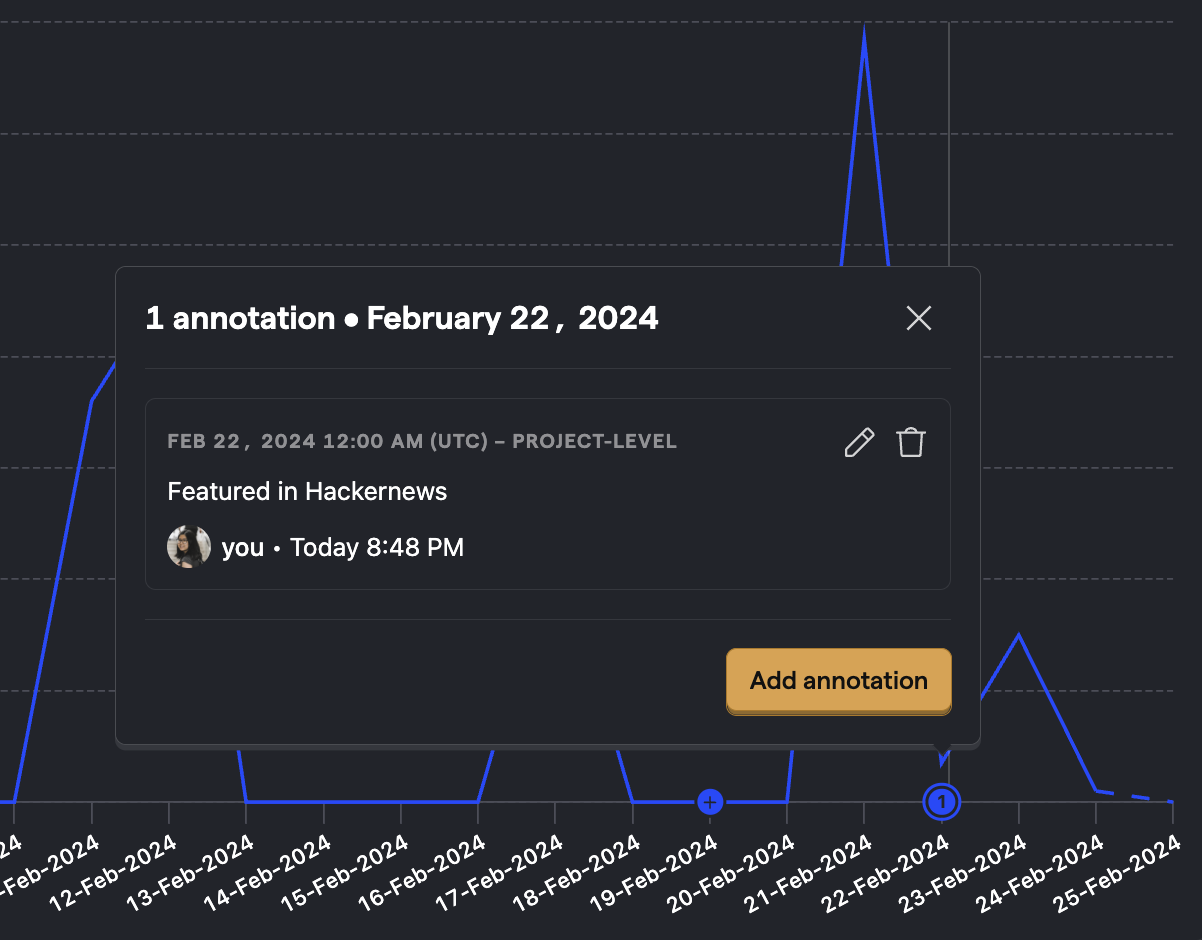
When editing a chart in Trends, Sessions or in a Dashboard, hover your cursor over the dates at the bottom of the chart to reveal a button with a + symbol. Clicking it will then open up a modal where you can create your Annotation, as well as choose to have it specifically for the current chart or all of your charts.
With your annotation created, it will now be available at the bottom of your chart, and you can also view all of your existing annotations in /data-management/annotations.
Adding an emoji to an annotation
You can add an optional emoji to any annotation for quick visual identification — for example, 🚀 for a release or 🔥 for an incident.
When creating or editing an annotation, use the Emoji picker in the annotation modal to select an emoji. Click the ✕ button next to the selected emoji to remove it.
Emojis appear in several places across the UI:
- Annotations table – The emoji displays next to the annotation content.
- Annotation card – The emoji appears in the card header when viewing annotation details on a chart.
- Chart overlay badge – When all annotations at a given date share the same emoji, that emoji replaces the default count badge. If annotations have different emojis or no emoji, the standard count badge is shown instead.
Showing and hiding annotations
You can toggle annotations on or off directly from an insight or dashboard card without opening the full insight editor.
From the insight editor, use the Show annotations checkbox in the chart configuration options. From a dashboard, click the ⋯ menu on an insight card and select Show annotations or Hide annotations.
This is available for:
- Trends time-series charts – Line charts, bar charts, and area charts (excludes non-time-series displays like pie charts and tables)
- Funnel historical trends – Funnels using the trends visualization type
Annotations are shown by default. This setting is saved to the insight and applies everywhere it appears.
Managing annotations via AI agents
You can manage annotations using AI coding assistants like Cursor, Claude Code, VS Code, or any tool that supports the Model Context Protocol (MCP).
With the PostHog MCP server connected, you can ask your AI agent to:
- Create annotations to mark deployments, releases, or incidents
- List existing annotations to review what's been marked
- Retrieve, update, or delete specific annotations
For example, you might prompt: "Create an annotation for today saying 'Deployed checkout v2.0'" and the agent will create it in your project.
This is useful for marking deployments directly from your development workflow without switching to the PostHog app.